Now when we have GVM10 with a good Assets/Host model, we wanted to start use that data.
The thing is that we usually split our scans into “real” subnets, and mostly those are /24’s and there are lots of free ip’s on those subnets.
When we do a host discovery all the ip’s that has been scanned is added to the asset/host data.
Before when we didn’t use the inventory this wasn’t an issue, but it would be interesting to hear what others are doing to keep this clean?
If we do a scan before and push those hosts in with the api, we must recreate the task every time to match the new targets. And then we get no good “stats” over time on that subnet.
Any ideas is welcome, and if I missed something that is obvious, I apologize in advance
AFAIK only hosts which have at least one results within the scan report will be added to the asset database. If there are dead hosts added as well make sure that the:
used scan configuration doesn’t have configured Ping Host (OID: 1.3.6.1.4.1.25623.1.0.100315) VT to have e.g. “Mark unrechable Hosts as dead (not scanning)” or “Report about unrechable Hosts” set to “no”.
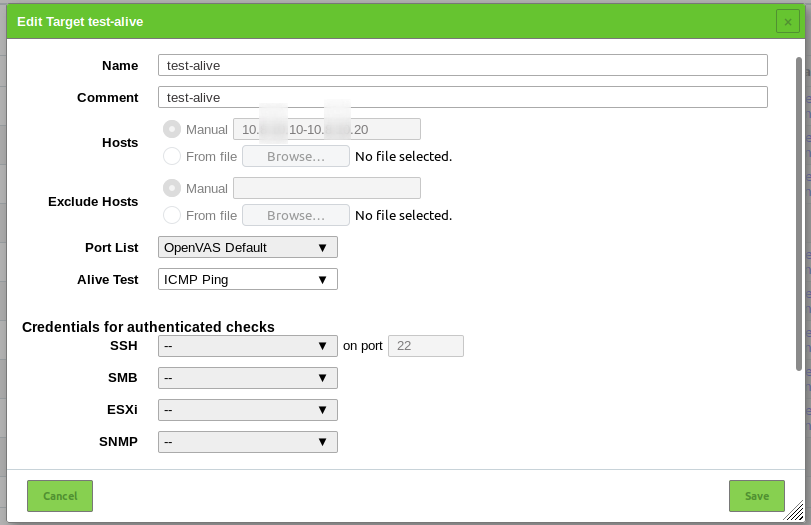
Chosen “Alive Test” from 1. is matching your network environment so that dead host are detected accordingly and not seen as alive.
I found something strange when using remote scanners.
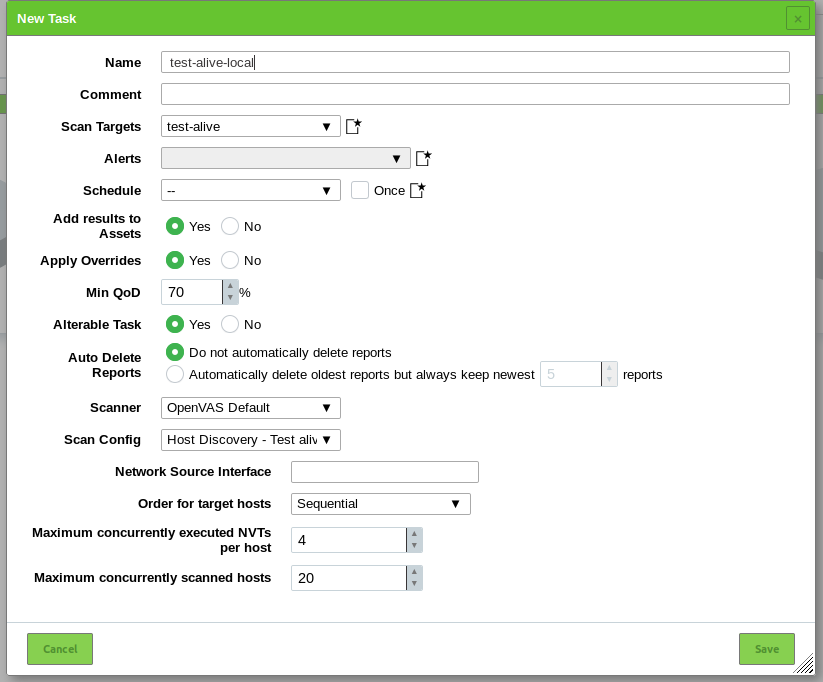
This morning I tried to do a testrun “locally” on the “master” gvm10…
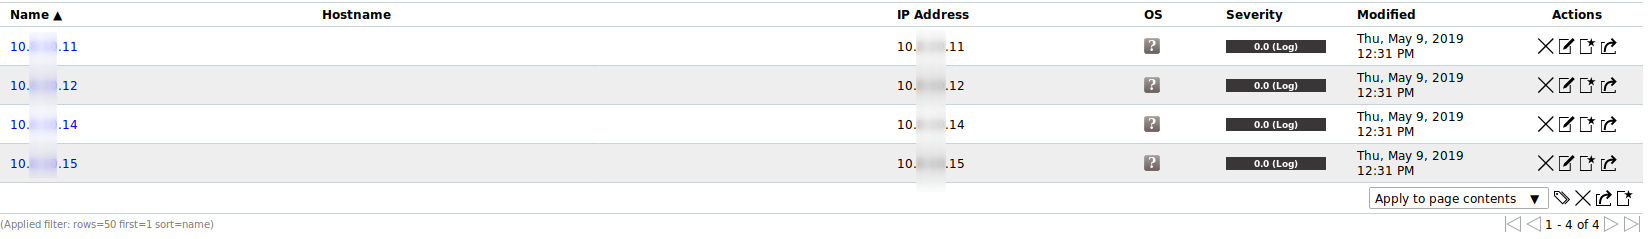
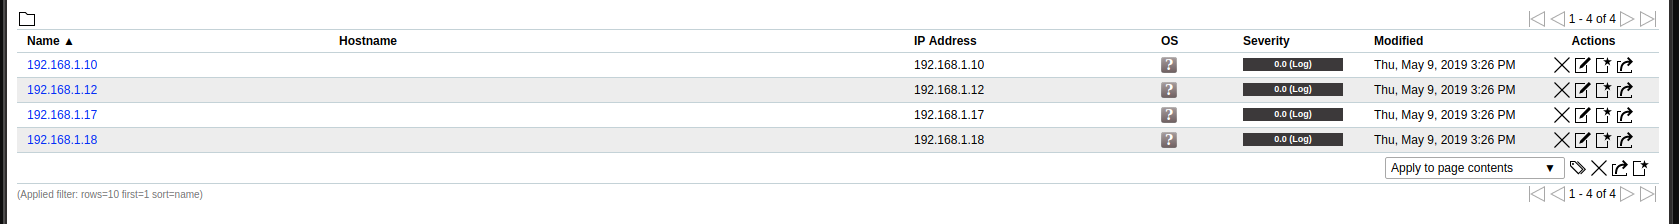
And it worked as you said. Only the ip’s that answered were added to the assets.
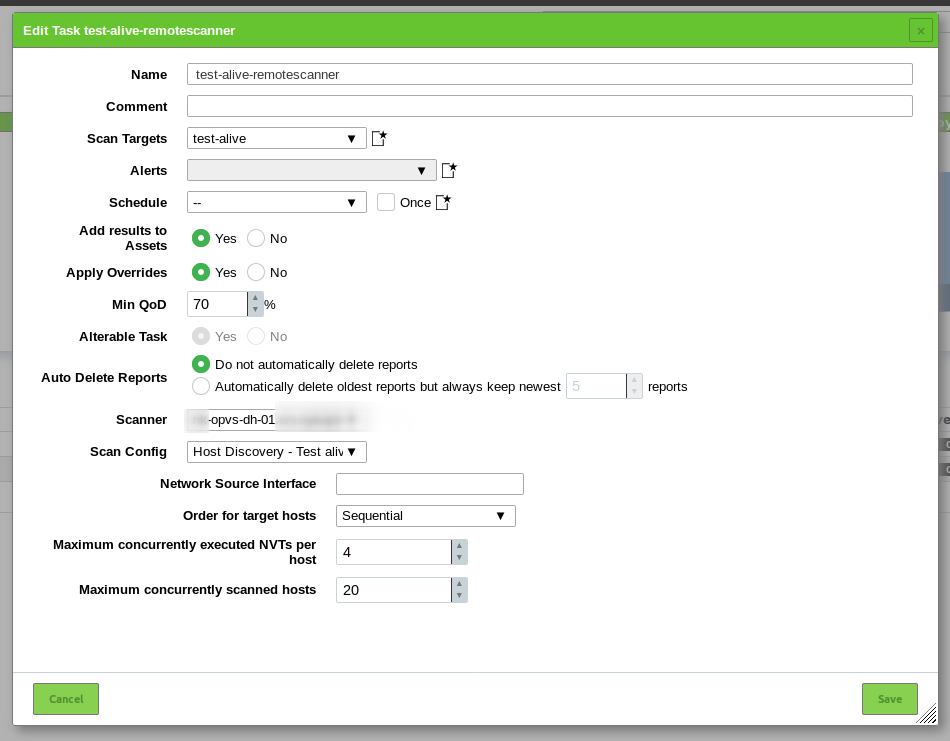
But then I cloned that task, and used a scanner(“slave”) instead.
And all the ip’s in the range were added to the assets?
I’m going to do some more checks with this today and see what’s going on
Any chances that the sensor is located in a different network segment where the sensor get a (falsely) positive response to the ICMP Ping “Alive Test” (e.g. from a firewall in between) where the local “master” isn’t getting one?
Any chances that the sensor is located in a different network segment where the sensor get a (falsely) positive response to the ICMP Ping “Alive Test” (e.g. from a firewall in between) where the local “master” isn’t getting one?
It shouldn’t be.[tm].
I’ll fire both of them up on the same subnet as the targets later.
The same config and targets are used with cloned tasks.
And the result differs (for me).
[edit] The “only” difference on the software side, is that the master is psql and the remote scanner is sqlite3.
Both are now running with psql container image.
[/edit]
Logs
Master:
gvm10_1 | ==> /usr/local/var/log/gvm/gvmd.log <==
gvm10_1 | event task:MESSAGE:2019-05-09 13h26.48 UTC:1208: Status of task alive-test-local (f5eb2da6-b680-4d2a-be57-dddc8c37e38b) has changed to Running
gvm10_1 |
gvm10_1 | ==> /usr/local/var/log/gvm/openvassd.log <==
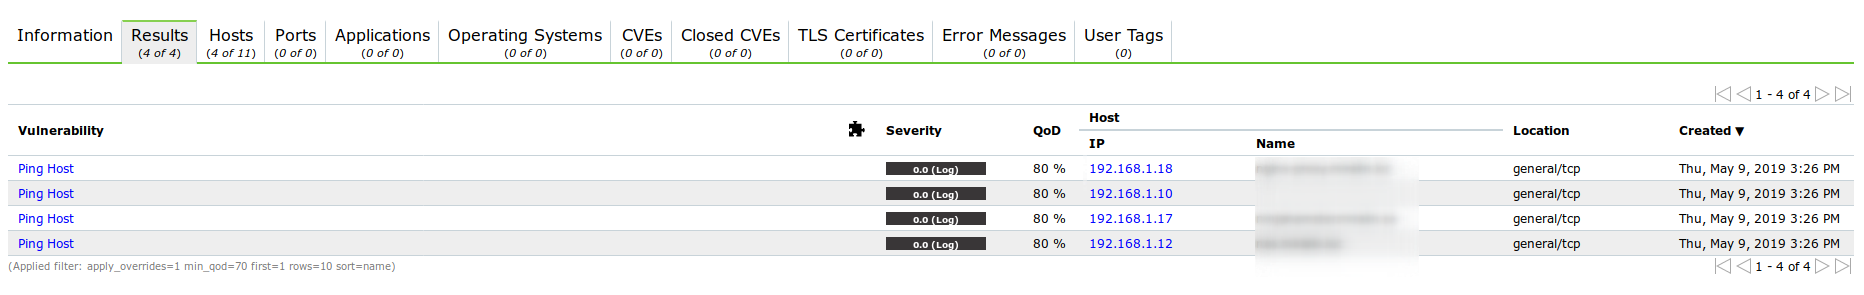
gvm10_1 | sd main:MESSAGE:2019-05-09 13h26.48 utc:1252: Finished testing 192.168.1.12. Time : 0.52 secs
gvm10_1 | sd main:MESSAGE:2019-05-09 13h26.48 utc:1261: Finished testing 192.168.1.17. Time : 0.50 secs
gvm10_1 | sd main:MESSAGE:2019-05-09 13h26.48 utc:1250: Finished testing 192.168.1.10. Time : 0.54 secs
gvm10_1 | sd main:MESSAGE:2019-05-09 13h26.48 utc:1263: Finished testing 192.168.1.18. Time : 0.69 secs
gvm10_1 | sd main:MESSAGE:2019-05-09 13h26.50 utc:1259: The remote host 192.168.1.16 is dead
gvm10_1 | sd main:MESSAGE:2019-05-09 13h26.50 utc:1251: The remote host 192.168.1.11 is dead
gvm10_1 | sd main:MESSAGE:2019-05-09 13h26.50 utc:1259: Finished testing 192.168.1.16. Time : 2.25 secs
gvm10_1 | sd main:MESSAGE:2019-05-09 13h26.50 utc:1251: Finished testing 192.168.1.11. Time : 2.29 secs
gvm10_1 | sd main:MESSAGE:2019-05-09 13h26.50 utc:1258: The remote host 192.168.1.15 is dead
gvm10_1 | sd main:MESSAGE:2019-05-09 13h26.50 utc:1265: The remote host 192.168.1.20 is dead
gvm10_1 | sd main:MESSAGE:2019-05-09 13h26.50 utc:1264: The remote host 192.168.1.19 is dead
gvm10_1 | sd main:MESSAGE:2019-05-09 13h26.50 utc:1253: The remote host 192.168.1.13 is dead
gvm10_1 | sd main:MESSAGE:2019-05-09 13h26.50 utc:1258: Finished testing 192.168.1.15. Time : 2.49 secs
gvm10_1 | sd main:MESSAGE:2019-05-09 13h26.50 utc:1256: The remote host 192.168.1.14 is dead
gvm10_1 | sd main:MESSAGE:2019-05-09 13h26.50 utc:1265: Finished testing 192.168.1.20. Time : 2.49 secs
gvm10_1 | sd main:MESSAGE:2019-05-09 13h26.50 utc:1264: Finished testing 192.168.1.19. Time : 2.50 secs
gvm10_1 | sd main:MESSAGE:2019-05-09 13h26.50 utc:1253: Finished testing 192.168.1.13. Time : 2.55 secs
gvm10_1 | sd main:MESSAGE:2019-05-09 13h26.50 utc:1256: Finished testing 192.168.1.14. Time : 2.55 secs
gvm10_1 | sd main:MESSAGE:2019-05-09 13h26.50 utc:1204: Test complete
gvm10_1 | sd main:MESSAGE:2019-05-09 13h26.50 utc:1204: Total time to scan all hosts : 3 seconds
gvm10_1 |
gvm10_1 | ==> /usr/local/var/log/gvm/gvmd.log <==
gvm10_1 | event task:MESSAGE:2019-05-09 13h26.52 UTC:1208: Status of task alive-test-local (f5eb2da6-b680-4d2a-be57-dddc8c37e38b) has changed to Done
Remote scanner:
gvm10_1 | ==> /usr/local/var/log/gvm/gvmd.log <==
gvm10_1 | event task:MESSAGE:2019-05-09 13h27.55 UTC:247: Status of task 5bfbceef-778c-4ee9-a08f-c2ce0904e372 for alive-test-scanner (ce231788-f9d3-4549-b00d-06c7c8feacb8) has changed to Running
gvm10_1 |
gvm10_1 | ==> /usr/local/var/log/gvm/openvassd.log <==
gvm10_1 | sd main:MESSAGE:2019-05-09 13h27.56 utc:258: The remote host 192.168.1.16 is dead
gvm10_1 | sd main:MESSAGE:2019-05-09 13h27.56 utc:249: The remote host 192.168.1.11 is dead
gvm10_1 | sd main:MESSAGE:2019-05-09 13h27.56 utc:251: The remote host 192.168.1.13 is dead
gvm10_1 | sd main:MESSAGE:2019-05-09 13h27.56 utc:262: The remote host 192.168.1.19 is dead
gvm10_1 | sd main:MESSAGE:2019-05-09 13h27.56 utc:252: The remote host 192.168.1.14 is dead
gvm10_1 | sd main:MESSAGE:2019-05-09 13h27.56 utc:255: The remote host 192.168.1.15 is dead
gvm10_1 | sd main:MESSAGE:2019-05-09 13h27.56 utc:264: The remote host 192.168.1.20 is dead
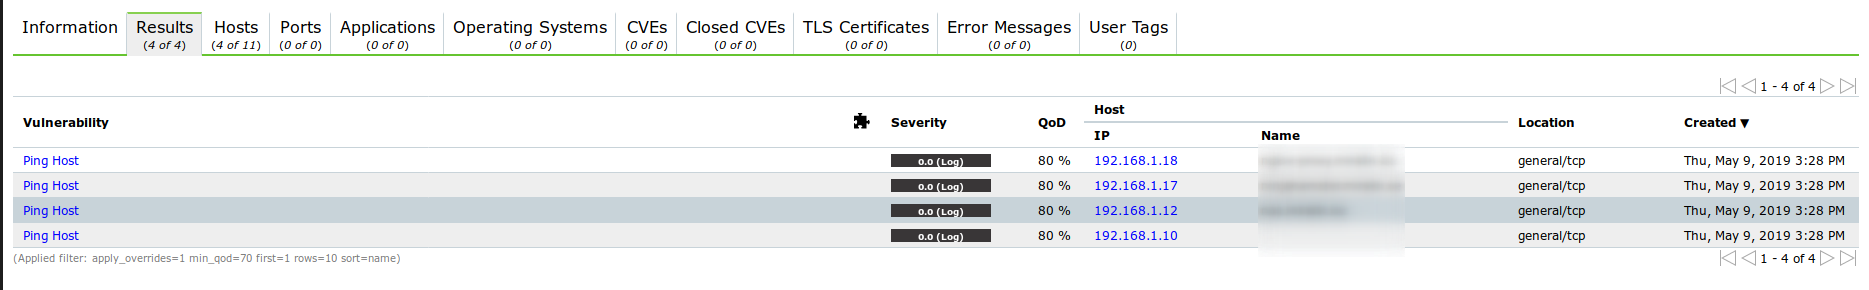
gvm10_1 | sd main:MESSAGE:2019-05-09 13h27.56 utc:258: Finished testing 192.168.1.16. Time : 2.31 secs
gvm10_1 | sd main:MESSAGE:2019-05-09 13h27.56 utc:249: Finished testing 192.168.1.11. Time : 2.34 secs
gvm10_1 | sd main:MESSAGE:2019-05-09 13h27.56 utc:251: Finished testing 192.168.1.13. Time : 2.33 secs
gvm10_1 | sd main:MESSAGE:2019-05-09 13h27.56 utc:262: Finished testing 192.168.1.19. Time : 2.32 secs
gvm10_1 | sd main:MESSAGE:2019-05-09 13h27.56 utc:252: Finished testing 192.168.1.14. Time : 2.35 secs
gvm10_1 | sd main:MESSAGE:2019-05-09 13h27.56 utc:255: Finished testing 192.168.1.15. Time : 2.34 secs
gvm10_1 | sd main:MESSAGE:2019-05-09 13h27.56 utc:264: Finished testing 192.168.1.20. Time : 2.33 secs
gvm10_1 |
gvm10_1 | ==> /usr/local/var/log/gvm/gvmd.log <==
gvm10_1 | event task:MESSAGE:2019-05-09 13h27.58 UTC:247: Status of task 5bfbceef-778c-4ee9-a08f-c2ce0904e372 for alive-test-scanner (ce231788-f9d3-4549-b00d-06c7c8feacb8) has changed to Done
Comparing the reports of both scans could show if there are any additional log messages shown in the one which is adding the dead hosts to the asset database.
Try to bypass and nat and stateful firewall these tables are the natural enemy of vulnerability scanning esp if you have dead hosts and use all TCP this will fill up the table and can lead to strange network issues.
That might be totally depending on the “Container Host Kernel”, so just connect a real Ethernet interface and try to use a Kernel that is NOT using any stateful Firewall/NAT/LoadBalancer.
But if I do the test one two “installations”, Master and Slave.
When I run them in a master/slave setup I get the “dead ip’s”.
But if I run the same tasks locally on each server I get no “dead ip’s”?
Then, the network/NAT should experience the same even if I run it locally?
That’s fair
I agree that the fw/nat/lb isn’t optimal in any way.
And that is perhaps something to look into on the containers, if I can
But the problem exists for me even on a source installation with no funniness on the interfaces. [edit] Except that they are VM’s on the same subnet[/edit]
Tried out 11 ip’s on a simple local network with 4 hosts. Two identical installations. A and B.
On the HOST dash:
A - local scan: registers 4 ip's.
B - local scan: registers 4 ip's.
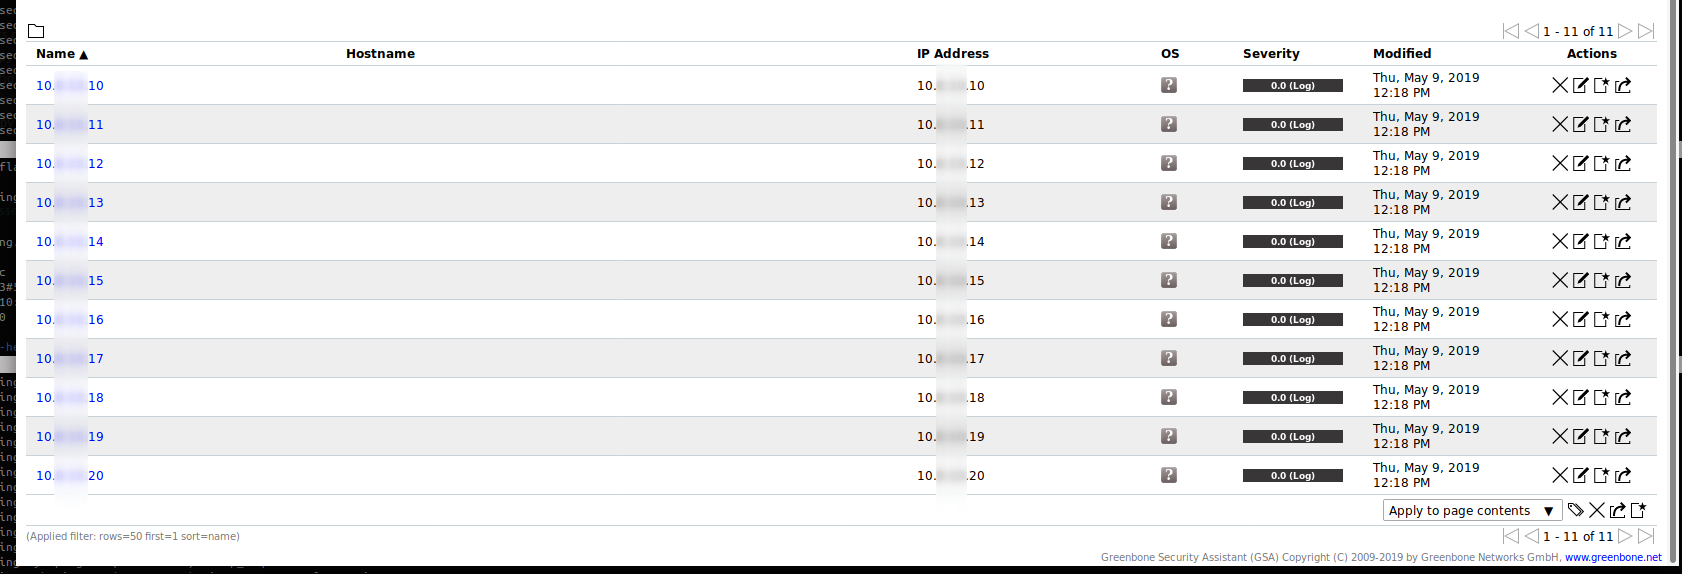
A(master) » B(scanner) - remote scan: registers the whole range, 11 ip's
I don’t really know how to debug this behavior, or if I am the only one with this “problem”.
Then the problem is locally here, and I am doing something fundamentally wrong


 And the state of the host might be different, timeout, table size, etc … etc…


